Population & housing growth in Australia
Population & housing growth in Australia

This article projects population and housing growth in Australia, NSW & Sydney from 2011-2015 compared with the number being built
Population & Housing Growth - Australia
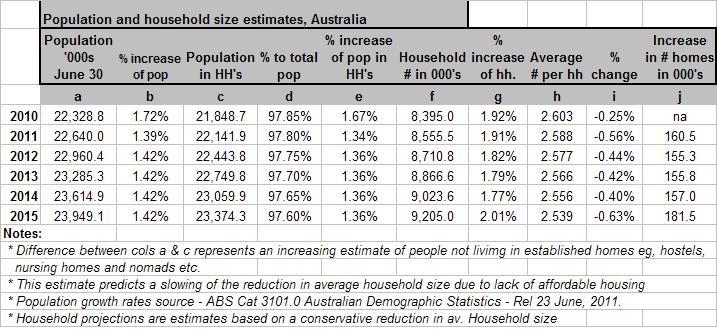
The table below is my conservative estimate of Australia’s population and number of households, for the five years 2011 through to 2015. It is based on the latest ABS data
The population increases average about 327,000 pa over the next few years and consist of about 49% natural increase (+160,000) and the balance 51% net overseas immigration (+167,000). This will necessitate 162,300 net new homes. Note that this level of immigration is about 89,000 pa less than the peak recent average of 256,000 pa over the 4 years to June 30, 2010. If immigration levels return to those former high levels, population growth will average 1.8% pa instead of 1.4% pa. Such a growth rate would require another 34,700 pa therefore averaging +197,000 net new homes pa. I doubt the current Labour/ Greens alliance would allow this to happen. Note: Net new homes are new buildings less knock-down rebuilds
Population & Housing Growth - NSW
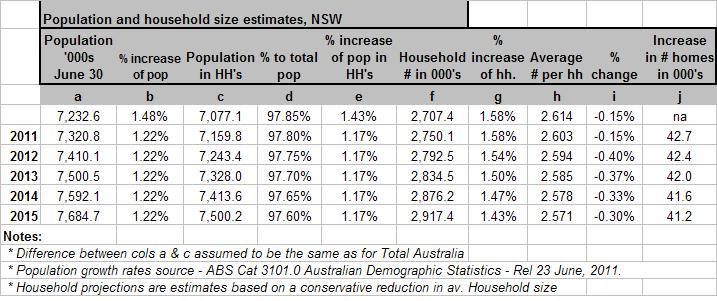
The table below is my conservative estimate of NSW’s population and number of households, for the five years 2011 through to 2015. It is also based on the latest ABS data.
The population increases average about 91,000 pa over the next few years and consist of about 55% natural increase (+50,000), about 62% net overseas immigration (+56,000) and the balance negative 16% net interstate migration (-15,000). This will necessitate 41,800 net new homes. Note that this total state level of net overseas immigration is about 24,000 pa less than the peak recent average of 80,000 pa over the 3 years to June 30, 2010. If immigration levels return to those former high levels, population growth will average 1.7% pa instead of 1.4% pa. Such a growth rate would require another 9,200 homes pa therefore averaging +51,000 net new homes pa.
Population & Housing Growth - Sydney
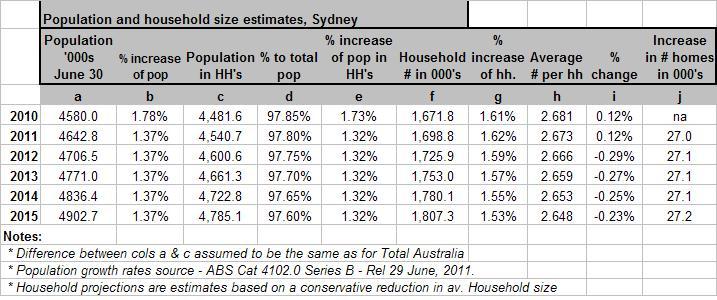
The table below is my conservative estimate of Sydney’s population and number of households, for the five years 2011 through to 2015. It is also based on the latest ABS data.
The population increases average about 65,000 pa over the next few years and consist of about 54% natural increase (+35,000), and the balance of about 46% representing net total overseas, interstate and intrastate migration (+30,000). This will necessitate 27,100 net new homes.Note that this total Sydney level of immigration is about 12,000 pa less than the peak recent average of 77,000 pa over the 3 years to June 30, 2010. If immigration levels return to those former high levels, population growth will average 1.67% pa instead of 1.4% pa. Such a growth rate would require another 4,500 homes pa therefore averaging +31,600 net new homes pa.
Dwelling units commenced - Australia
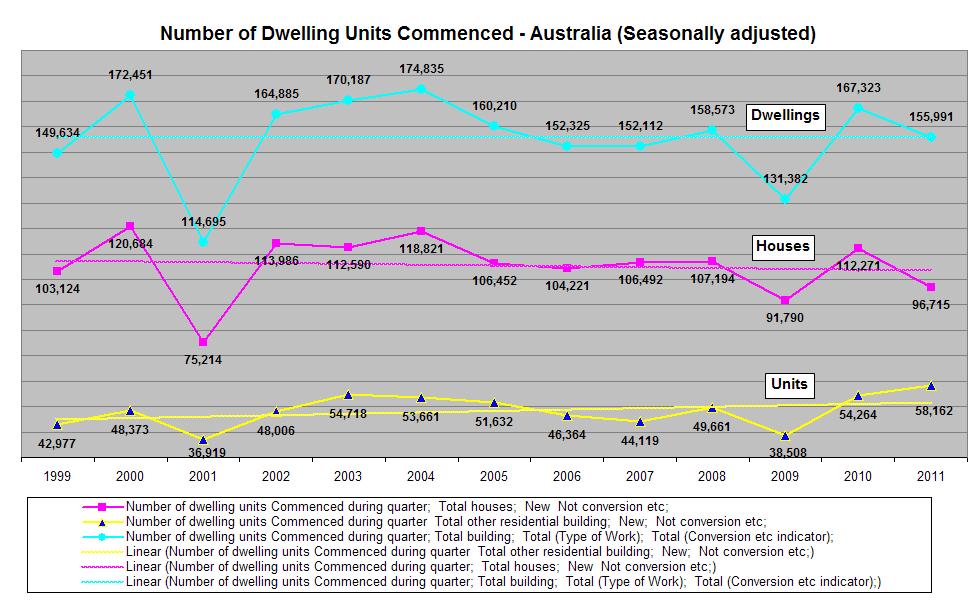
Now the chart below shows that the number of dwelling units commenced (houses & units/apts) in total Australia has averaged 156,000 pa over the last 13 years. A 10% increase will be required over the next few years in order to supply Australia’s housing needs of 172,000 pa (i.e., 162,000 + est. 10,000 knock-down rebuilds) provided immigration remains at the current lower levels.
At the higher immigration level of recent past years, a 34% average increase would be necessary to supply 209,000 new dwellings pa (i.e., 197,000 + est. 12,000 knock-down rebuilds).
Note that house commencements have averaged 2/3rds of total dwelling units but are declining in favour of units/apts.
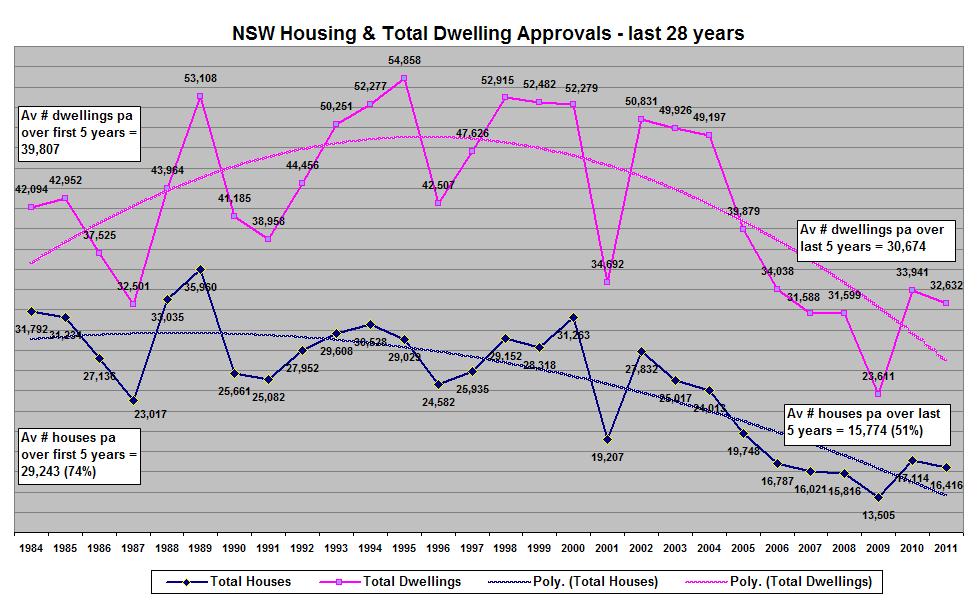
Dwelling unit approvals - NSW
The chart below clearly shows the housing problem in NSW (predominately in Sydney). The average number of dwelling approvals over the last 5 years is significantly less than in the 1990’s and even the 1980’s. At a total of 46,448 dwellings (30,674 units and 15,774 houses) pa approvals from 2007 to 2011 it would seem at first glance to exceed the 40,400 pa required net new homes during that period. However if 1 in 3 net new homes is a ‘Knock-down rebuild’1, then we lose 1/3 *15,774 dwellings = 5,258 dwellings + another 1,000 (say) to build apartment buildings leaving us with a net gain of 40,190 new dwellings pa.
The above NSW conservative estimate of net new homes required over the next few years is 41,800 pa. Adding (say) 6,500 knock-downs we arrive at a total new dwellings requirement of 48,300 pa, a 4% increase on the average of recent approvals.
At the higher immigration level of recent past years, we would need 51,000 net new dwellings pa over the next few years. Adding (say) 8,000 'knock-down rebuilds', we would need to build 59,000 new dwellings, an increase of 27% over recent approvals.
We also have no way of knowing how many of these new dwellings are holiday or second homes not fully utilised. The net result is that the housing stock is certainly not increasing and may well be diminishing.
The only alterntives are for Australians and Sydney residents in particular to significantly invest in new housing stock, or reverse the declining trend in the number of people per household. This would be bad new for first home buyers (and their parents).
Note 1- Source: Homeworld Visitor Survey June, 2010 (Solutions Marketing & Consulting P/L)